Author: Amber Colvin

  • df.rename: How to rename a pandas column in a DataFrame

    df.rename: How to rename a pandas column in a DataFrame

    Use df.rename() to rename a pandas column, several columns, or index labels without rebuilding the DataFrame. The method accepts explicit old-to-new mappings for targeted edits and callable functions for systematic cleanup.

    By default, rename() returns a new DataFrame and leaves the original unchanged. That behavior makes it suitable for a clear, assignable pandas DataFrame’s rename method.

    How to rename a DataFrame column or several columns with df.rename()

    Use columns={old: new} when you rename a pandas DataFrame

    Pass a dictionary to columns. Each key is the existing column label, and each value is its replacement. The mapping always goes from old name to new name:

    renamed = df.rename(columns={“Name”: “name”})

    This creates a new DataFrame with Name changed to name. The original df still has its original labels. To rename several columns, include multiple entries:

    renamed = df.rename(columns={
        “First Name”: “first_name”,
        “Order Total”: “order_total”
    })

    Columns not listed in the dictionary remain unchanged. This is the direct way to rename a DataFrame column when you know the exact labels. Do not reverse the dictionary: {“name”: “Name”} searches for a column already named name and changes it to Name.

    Should you return a new DataFrame or change a DataFrame column name in place?

    Return a new DataFrame by default and assign it

    The default operation returns a renamed copy-like DataFrame object:

    df2 = df.rename(columns={“old_name”: “new_name”})

    Use assignment when you want to preserve the original DataFrame, keep a clearly named transformed object, or chain the result with other operations. You can also replace the original variable:

    df = df.rename(columns={“old_name”: “new_name”})

    Use inplace=True when you do not need a returned object

    Set inplace=True to update df directly:

    df.rename(columns={“old_name”: “new_name”}, inplace=True)

    This operation returns None, so do not assign its result back to df. Choose the default returned-DataFrame behavior when you want easier debugging, reversible steps, or a transformation pipeline. Choose in-place behavior when direct mutation is intentional and you do not need the method’s return value.

    Choose errors=’raise’ or ‘ignore’ for missing labels

    By default, errors=”ignore” leaves a mapping unchanged if its old label is absent. To catch misspelled or unexpected labels, use:

    df.rename(columns={“Oder Total”: “order_total”}, errors=”raise”)

    A missing source label then raises a KeyError. Use errors=”ignore” when a mapping may apply only to some DataFrames, and errors=”raise” when every requested rename must succeed.

    How to transform every column label with a callable

    Use a callable to clean labels and display the final columns

    Pass a function to columns when every label needs the same transformation. The callable receives one label at a time and must return its replacement. This example strips surrounding whitespace, converts labels to lowercase, and replaces spaces with underscores:

    clean = df.rename(
        columns=lambda column: column.strip().lower().replace(” “, “_”)
    )

    For input labels Customer ID, Order Total, and Order Date, display the result with:

    print(clean.columns.tolist())

    [‘customer_id’, ‘order_total’, ‘order_date’]

    A callable is useful for consistent label cleanup, while a dictionary is safer when only selected columns should change. If labels are not all strings, account for their types before calling string methods.

    How to rename index labels or a MultiIndex level

    Rename ordinary index labels

    Use index instead of columns to rename row labels:

    df2 = df.rename(index={0: “first”, 1: “second”})

    This changes labels, not row positions or the values stored in the DataFrame.

    Rename one level of a MultiIndex

    For hierarchical columns or rows, supply the level name or number. To rename labels in the second level of a MultiIndex column:

    df2 = df.rename(
        columns={“Q1”: “first_quarter”},
        level=1
    )

    Use index= for a MultiIndex on rows. The level argument limits the mapping to one hierarchy level, leaving labels in the other levels unchanged.


  • SQL split string: SQL string splitting by database engine

    SQL split string: SQL string splitting by database engine

    An SQL split string operation is database-specific. SQL Server, PostgreSQL, MySQL, and Oracle use different functions and return different shapes. To split string in SQL, choose the syntax for your database engine, then define how ordering, empty tokens, and delimiters should behave.

    This SQL string split guide returns usable rows or array elements rather than treating one function as portable standard SQL.

    SQL split string: SQL Server STRING_SPLIT, ordinals, and empty tokens

    SQL Server uses STRING_SPLIT and normally returns one row per token in a value column. SQL Server 2022 and supported Azure versions can also return an ordinal column by passing 1 as the third argument.

    Input and query:

    DECLARE @s nvarchar(100) = N’red,,blue’;

    SELECT s.ordinal, s.value
    FROM STRING_SPLIT(@s, N’,’, 1) AS s
    ORDER BY s.ordinal;

    The result is ordered rows: red, an empty value, and blue. Without the ordinal option, output order is not guaranteed. Consecutive delimiters produce empty substrings; filter them with WHERE s.value <> N” when they are not meaningful. STRING_SPLIT accepts a single-character separator, so use another method for multi-character delimiters.

    PostgreSQL: string_to_array and regexp_split_to_table for arrays or rows

    PostgreSQL offers a literal-delimiter function and a regular-expression function. string_to_array returns one array, supports multi-character text delimiters, and preserves empty fields between delimiters.

    Array input:

    SELECT string_to_array(‘red,,blue’, ‘,’) AS pieces;

    To turn that array into ordered rows, use unnest with ordinality:

    SELECT x.position, x.piece
    FROM unnest(string_to_array(‘red,,blue’, ‘,’)) WITH ORDINALITY AS x(piece, position)
    ORDER BY x.position;

    For a regular-expression delimiter, use regexp_split_to_table:

    SELECT x.piece
    FROM regexp_split_to_table(‘red||blue||green’, E’\|\|’) AS x(piece);

    This returns rows directly. Regex matching determines the split behavior; zero-length matches at the beginning or end are ignored. Use a pattern that matches the delimiter itself when empty values matter.

    MySQL: JSON_TABLE or recursive splitting for rows

    MySQL 8.0 has no general-purpose native split function. JSON_TABLE provides a compact row-producing pattern by converting the delimited value to a JSON array. The example below supports a multi-character literal delimiter and preserves empty values.

    Input and query:

    SET @s = ‘red||||blue’;

    SET @delimiter = ‘||’;

    SELECT j.item_no, j.value
    FROM JSON_TABLE(
    CONCAT(‘[‘, REPLACE(JSON_QUOTE(@s), @delimiter, ‘”,”‘), ‘]’),
    ‘$[*]’ COLUMNS (
    item_no FOR ORDINALITY,
    value VARCHAR(100) PATH ‘$’
    )
    ) AS j
    ORDER BY j.item_no;

    The returned rows are red, an empty value, and blue. This conversion treats the delimiter literally, not as a regular expression, and assumes the delimiter does not occur inside a value. For more complex parsing rules, a recursive common table expression can repeatedly locate the delimiter with LOCATE or INSTR and return each piece with its position.

    Oracle: REGEXP_SUBSTR for ordered rows and regex delimiters

    Oracle can extract the nth token with REGEXP_SUBSTR. REGEXP_COUNT supplies the number of rows, making the result ordered and allowing empty tokens to remain visible as NULL.

    Input and query:

    SELECT LEVEL AS position,
    REGEXP_SUBSTR(‘red,,blue’, ‘([^,]*)(,|$)’, 1, LEVEL, NULL, 1) AS piece
    FROM dual
    CONNECT BY LEVEL <= REGEXP_COUNT(‘red,,blue’, ‘,’) + 1
    ORDER BY position;

    The first capture group returns each token, including the empty middle token; Oracle represents an empty string as NULL. REGEXP_SUBSTR accepts regular-expression delimiters, so the capture pattern can be adapted for multi-character separators such as :: or more complex boundary rules. Keep the row-count expression aligned with that delimiter and use ORDER BY position for deterministic output.

  • SDLC planning phase: From feasibility to maintenance

    SDLC planning phase: From feasibility to maintenance

    The SDLC planning phase turns a software idea into an approved, bounded project. It defines the problem, tests whether the solution is feasible, sets scope, identifies stakeholders and risks, and establishes the resources and schedule needed for delivery.

    Planning is separate from detailed requirements analysis. It decides whether and how to pursue the work; requirements work later defines what the system must do in verifiable detail.

    What happens in the SDLC planning phase?

    Planning creates a shared delivery baseline before analysts and developers begin detailed discovery. The team typically:

    • Defines the problem: states the user need, expected outcome, and reason the project matters.
    • Checks feasibility: assesses technical capability, budget, timing, operational fit, and major constraints.
    • Sets scope: records included features, exclusions, assumptions, dependencies, and success measures.
    • Maps stakeholders: identifies the sponsor, users, product owner, delivery team, operations staff, and approvers.
    • Plans resources and schedule: assigns roles, tools, environments, budget, milestones, and an initial delivery sequence.
    • Identifies risks: records threats such as integration failure, unclear ownership, data loss, or unrealistic deadlines, along with mitigations.

    Where does the planning phase of SDLC fit?

    The planning phase of SDLC comes before requirements, design, implementation, testing, deployment, and maintenance. It can be revisited when new evidence changes scope, cost, or risk, but it should provide an approved starting point for the next phase.

    Planning answers, “Should this project proceed, and under what boundaries?” Requirements analysis answers, “What must the product do?” Keeping those decisions separate prevents a rough project idea from being mistaken for a complete specification.

    Which planning outputs and exit criteria let requirements work begin?

    Useful planning outputs make the project understandable and governable. They commonly include:

    • A problem statement or project charter
    • A feasibility assessment and initial business case
    • A scope statement with exclusions and success measures
    • A stakeholder register and responsibility outline
    • A resource plan and milestone schedule
    • A risk register with owners and response actions

    Requirements work can begin when the sponsor or product owner approves the problem, scope, feasibility case, initial resources, and delivery approach. The team should also know who can make decisions and how risks will be escalated. Detailed user stories, functional requirements, acceptance criteria, and the requirements specification are outputs of the next phase, not substitutes for the planning package.

    What are the SDLC phases with examples for one small app?

    Consider a shared grocery-list app for households. Its limited purpose is to let invited users add, edit, and mark items as purchased.

    1. Planning: The team confirms that households need a shared list and that a mobile-friendly web app is technically and financially feasible. Version one excludes recipes, payments, and delivery integration. Two developers, one designer, and a product owner receive a four-week schedule. A key risk is conflicting edits, with synchronization rules planned as a mitigation.
    2. Requirements: Analysts interview household users and document stories such as “add an item,” “assign a quantity,” and “mark an item purchased.” They define permissions, error messages, and acceptance criteria for each story.
    3. Design: The team creates list-screen wireframes, a responsive layout, an invitation flow, and a data model for users, lists, and items. It also chooses an approach for handling simultaneous edits.
    4. Implementation: Developers build the interface, authentication, list APIs, database, and synchronization behavior within the approved scope.
    5. Testing: Testers check item updates, permissions, validation, synchronization, browser compatibility, and usability against the requirements and acceptance criteria.
    6. Deployment: The team releases the app to a small household pilot, configures production monitoring, and provides support instructions.
    7. Maintenance: The team fixes defects, monitors failures, improves synchronization, and evaluates requests such as recurring items for a later release.
  • Error Bars in Python: A Practical Matplotlib Guide

    Error Bars in Python: A Practical Matplotlib Guide

    Plot error bars in Python with Matplotlib’s plt.errorbar() function by supplying x and y data plus uncertainty magnitudes through xerr or yerr. The same call supports one uncertainty for every point, per-point symmetric values, and separate lower and upper magnitudes.

    The examples below use one dataset throughout, so you can change the error input without changing the chart data.

    Plot error bars in Python with a complete runnable plt.errorbar() example

    Start with symmetric vertical errors. Each value in yerr specifies the same distance above and below its matching y value.

    Runnable example: import matplotlib.pyplot as plt; x = [1, 2, 3, 4]; y = [10, 13, 12, 15]; yerr = [1, 1.5, 0.8, 1.2]; plt.errorbar(x, y, yerr=yerr, fmt=’o-‘, capsize=4, color=’navy’, label=’Observed mean’); plt.xlabel(‘Sample’); plt.ylabel(‘Value’); plt.legend(); plt.show()

    Here, x, y, and yerr each contain four values, so every point has one matching error magnitude. The fmt=’o-‘ argument draws circular markers connected by a line. The label appears in the legend when plt.legend() is called.

    Choose symmetric and asymmetric values for Python error bars

    Error values describe distances, not endpoint coordinates. For N plotted points, Matplotlib accepts scalar, one-dimensional, or two-row asymmetric inputs.

    • Scalar: yerr=1 applies an error magnitude of 1 to every point.
    • One-dimensional: yerr=[1, 1.5, 0.8, 1.2] gives each point its own symmetric magnitude. The input shape is (N,).
    • Two-row asymmetric: yerr=[[1, 2, 1, 2], [2, 1, 2, 1]] uses shape (2, N). The first row contains lower magnitudes, and the second contains upper magnitudes.

    For asymmetric Python error bars, the lower and upper values must be nonnegative distances from each data point. With the existing dataset, replace the original yerr assignment with the two-row list, then run the same plt.errorbar() call. This creates different uncertainty ranges above and below each marker.

    Add horizontal and combined errors with xerr and yerr

    Use xerr for horizontal uncertainty. It follows the same scalar, one-dimensional, and (2, N) rules as yerr. For example, this call adds per-point horizontal errors while retaining vertical errors:

    plt.errorbar(x, y, xerr=[0.1, 0.2, 0.15, 0.25], yerr=[1, 1.5, 0.8, 1.2], fmt=’o’, capsize=4, label=’Measured values’)

    Both arrays must match the four plotted points. A scalar such as xerr=0.2 applies the same horizontal distance everywhere. To make horizontal errors asymmetric, provide a two-row xerr input, such as [[0.1, 0.2, 0.1, 0.2], [0.2, 0.1, 0.2, 0.1]].

    Style a Matplotlib errorbar chart with fmt, caps, markers, and legends

    The Matplotlib errorbar function separates data styling from error styling, giving you control over readability:

    • fmt: Use ‘o’ for markers without a connecting line, ‘o-‘ for markers and a line, or ‘none’ for errors without a data marker or line.
    • capsize: Set the cap length in points, such as capsize=5. Use capthick to adjust cap thickness when needed.
    • Colors: Set color=’navy’ for the data series and ecolor=’gray’ for the error bars. Add markersize or elinewidth for further control.
    • Labels: Use xlabel() and ylabel() for axes. Pass a distinct label to each errorbar call, then call plt.legend() to identify the series.

    For multiple datasets, repeat the call with different colors, markers, and labels. Keep the error magnitudes aligned with each dataset’s x and y values so the caps and markers remain correctly paired.

  • Use plt.savefig() in Python to Save Matplotlib Figures

    Use plt.savefig() in Python to Save Matplotlib Figures

    Use savefig() in Python to export a Matplotlib figure before displaying it. The basic pattern is to create a figure, draw the data, call plt.savefig(), and then call plt.show(). Saving first avoids blank output caused by display backends that clear or close the current figure.

    The filename controls the usual output format, while options such as dpi, figsize, bbox_inches, and transparent control how the exported file is rendered. This gives you a reliable way to save a figure in Python for reports, web pages, or later editing.

    How do you use plt.savefig() in Python before display with pyplot or Figure?

    Create the figure explicitly and save it before show(). This pyplot example writes a PNG file to the current working directory:

    import matplotlib.pyplot as plt

    fig, ax = plt.subplots(figsize=(6, 4))

    ax.plot([1, 2, 3], [2, 4, 3])

    ax.set_title(“Example figure”)

    plt.savefig(“example.png”, dpi=300, bbox_inches=”tight”)

    plt.show()

    When working with multiple charts, prefer the Figure object. Its savefig() method saves that specific figure instead of whichever plot pyplot currently considers active:

    fig.savefig(“reports/line-chart.svg”, bbox_inches=”tight”)

    Create the destination directory first if it does not exist. The save operation can accept a string path or a path-like object such as pathlib.Path.

    How does savefig() in Python choose extensions, formats, and resolution?

    If you omit format, Matplotlib usually infers the format from the filename extension. For example, chart.png creates a PNG, chart.svg creates an SVG, and chart.pdf creates a PDF. You can also specify the format explicitly:

    fig.savefig(“chart-output”, format=”png”, dpi=300)

    Use PNG for web graphics and other raster images. Use SVG for diagrams that must remain sharp at different display sizes, and PDF for print-oriented documents or vector artwork. Matplotlib may also support formats such as JPEG, TIFF, and PS, depending on the installed backend.

    dpi sets raster resolution, measured in dots per inch. A value such as 150 works for many previews; 300 is a common print setting. DPI increases pixel density for PNG and similar raster formats. It does not control vector detail in SVG or PDF in the same way, because those formats describe lines and text mathematically. DPI can still affect rasterized elements embedded within a vector file.

    How do you save a figure in Python with figsize, transparency, and bbox_inches?

    Set figsize when creating the figure. Its values are width and height in inches, not pixels:

    fig, ax = plt.subplots(figsize=(8, 5))

    At 300 DPI, an 8-by-5-inch PNG is approximately 2,400 by 1,500 pixels before bounding-box adjustments. Change the figure dimensions for the layout you need, then use DPI to control raster density.

    Use transparent=True when the background should show through, such as when placing a chart over a colored document or slide:

    fig.savefig(“overlay.png”, dpi=300, transparent=True)

    Use bbox_inches=”tight” to trim excess whitespace around axes, labels, and titles. It is useful for compact exports, but inspect the result when annotations extend far outside the axes. A tight bounding box can also make the final dimensions differ from the original figsize.

    Why is the saved figure blank or clipped, and where is the file?

    A blank file usually results from saving after plt.show(), saving a different active figure, or creating the plot on one Figure object and exporting another. Save before display, and use fig.savefig() when the figure identity matters. In scripts that do not need an interactive window, save the file and omit show().

    Clipped titles, axis labels, or legends often need bbox_inches=”tight”. You can also reserve layout space when creating the figure:

    fig, ax = plt.subplots(figsize=(7, 4), constrained_layout=True)

    fig.savefig(“final-chart.png”, dpi=300, bbox_inches=”tight”)

    Confirm the output location by printing an absolute path. Relative filenames are resolved from Python’s current working directory, which may differ from your script’s folder:

    from pathlib import Path

    path = Path(“exports/final-chart.png”)

    fig.savefig(path, dpi=300)

    print(path.resolve())

  • How to Calculate Time Complexity: A Practical Guide

    How to Calculate Time Complexity: A Practical Guide

    To learn how to calculate time complexity, describe how an algorithm’s work grows as the input size grows. Define the input, identify a basic operation, count how often it runs, and simplify the resulting expression only after establishing that count. This process produces Big O notation, the standard way to describe runtime complexity.

    Time complexity analysis focuses on growth rather than the exact time on one machine. Constants, hardware differences, and small implementation details matter less than whether the work grows linearly, quadratically, logarithmically, or exponentially.

    How to Calculate Time Complexity from Input Size and a Basic Operation

    Start by naming the input size. Use n for the number of items in an array, the length of a string, or the number of nodes in a structure. Then choose a basic operation, such as a comparison, assignment, arithmetic operation, or array access. Count how many times that operation executes.

    For one loop that examines every item, the count is proportional to n:

    for each item in an array: compare the item with a target

    The comparison runs n times, so the complexity is O(n). If the loop performs three constant-time operations per item, the count might be 3n, but Big O removes the constant and still gives O(n).

    Do not infer complexity from the number of statements alone. A statement inside a loop may execute millions of times, while several statements outside the loop may execute only once. Count execution frequency instead.

    How Do Sequential and Nested Loops Affect Runtime Complexity?

    Sequential sections add their costs. If one loop takes O(n) and a later loop takes O(n), the total is O(n + n), which simplifies to O(n). More generally, add the expressions first, then remove constants and lower-order terms. O(n2 + n) becomes O(n2) because the quadratic term dominates as n grows.

    Nested loops usually multiply their costs. If an outer loop runs n times and an inner loop also runs n times for every outer iteration, the operation runs n × n times. The result is O(n2).

    Different bounds change the product. An outer loop that runs n times with an inner loop that runs 10 times has cost 10n, or O(n). An inner loop that runs from 1 through the current outer index performs 1 + 2 + … + n operations, which equals n(n + 1)/2 and simplifies to O(n2).

    When loop bounds depend on separate inputs, retain both variables. For example, comparing every item in an array of size n with every item in an array of size m costs O(nm), not automatically O(n2).

    When Does a Loop Become Logarithmic?

    A loop is logarithmic when each iteration reduces the remaining work by a constant factor. A counter that doubles, such as 1, 2, 4, 8, and so on, reaches n after about log2(n) iterations. A counter that halves follows the same growth pattern:

    while n is greater than 1: divide n by 2

    Its complexity is O(log n). The logarithm’s base is omitted in Big O because changing the base only changes a constant factor.

    A loop that increases its counter by one is different: 1, 2, 3, …, n requires O(n) iterations. If a logarithmic loop is placed inside a linear loop, multiply the costs to get O(n log n).

    How Does Time Complexity Analysis Handle Recursion and Cases?

    For recursion, write a recurrence that describes the work in one call and the smaller calls it creates. A recursive linear search that checks one item and then searches the remaining items has the worst-case recurrence:

    T(n) = T(n − 1) + O(1)

    Each call removes one item and adds constant work, so the calls total O(n). The base case stops when no items remain. By contrast, a recurrence such as T(n) = T(n/2) + O(1) has O(log n) complexity because the input is halved at every call.

    State the case being analyzed when the algorithm can stop early. For a linear search, the best case is O(1) when the first item matches. The average case is O(n) when a match is equally likely at any position, because the expected scan covers about half the input. The worst case is O(n) when the match is last or absent. These cases differ because the input’s position or contents change how much work the algorithm performs.

  • How to Create a Bar Graph in R

    How to Create a Bar Graph in R

    To create a bar graph in R, use base R’s barplot() function when you need a quick chart from category values. Use ggplot2 when you need layered styling, grouped bars, or a consistent plotting workflow.

    The key decision is whether your input contains raw observations or values already summarized by category. The same distinction applies to bar graphs in R generally: count raw categories first, but pass precomputed heights directly to the chart.

    How do you prepare counts or summarized values?

    Raw categorical observations contain one category per record. Convert them to counts with table() before plotting. In contrast, a named numeric vector such as sales already contains the bar heights.

    Raw observations:

    observations <- c(“Apples”, “Bananas”, “Apples”, “Oranges”, “Bananas”, “Apples”)

    counts <- table(observations)

    Pre-summarized values for the examples below:

    sales <- c(Apples = 12, Bananas = 8, Oranges = 15)

    Do not treat a histogram as a substitute for a categorical bar chart. Histograms group numeric measurements into intervals, while bar charts compare named categories. If your data is raw, use table(observations); if the heights are already calculated, use the named vector directly.

    How do you create a bar graph in R with barplot()?

    Pass the summarized vector to barplot(). The vector names become the category labels. Use main for the title, xlab and ylab for axis labels, and col for bar colors.

    barplot(sales, main = “Units sold by fruit”, xlab = “Fruit”, ylab = “Units sold”, col = c(“tomato”, “gold”, “darkorange”))

    This produces vertical bars for Apples, Bananas, and Oranges. For raw observations, replace sales with counts. The count values, category names, and their order are then taken from the result of table().

    A matrix creates grouped bars. Each column represents a category, and each row represents a series:

    grouped <- rbind(Online = c(7, 5, 5), Store = c(5, 3, 10)); colnames(grouped) <- names(sales); barplot(grouped, beside = TRUE, legend.text = rownames(grouped), col = c(“steelblue”, “gray70”))

    How do you recreate the chart with ggplot2?

    Convert the named vector to a data frame, then map the category column to the x-axis and the value column to the y-axis. geom_col() is appropriate for pre-summarized heights because it uses the supplied values rather than counting rows.

    library(ggplot2); sales_df <- data.frame(Fruit = names(sales), Units = as.numeric(sales)); ggplot(sales_df, aes(Fruit, Units)) + geom_col(fill = “steelblue”) + labs(title = “Units sold by fruit”, x = “Fruit”, y = “Units sold”)

    For raw observations, use geom_bar(), which counts rows automatically:

    ggplot(data.frame(Fruit = observations), aes(Fruit)) + geom_bar(fill = “steelblue”) + labs(x = “Fruit”, y = “Count”)

    How does an R bar graph handle labels and orientation?

    Set horiz = TRUE in base R to rotate the bars. Use las = 1 to keep the category labels horizontal and readable:

    barplot(sales, horiz = TRUE, las = 1, xlab = “Units sold”, ylab = “Fruit”, col = c(“tomato”, “gold”, “darkorange”))

    In ggplot2, use coord_flip() after defining the chart:

    ggplot(sales_df, aes(Fruit, Units)) + geom_col(fill = “steelblue”) + labs(x = “Fruit”, y = “Units sold”) + coord_flip()

    For grouped values in ggplot2, add a grouping column and map it to fill. Use position = “dodge” for side-by-side bars:

    grouped_df <- data.frame(Fruit = rep(names(sales), 2), Channel = rep(c(“Online”, “Store”), each = 3), Units = c(7, 5, 5, 5, 3, 10)); ggplot(grouped_df, aes(Fruit, Units, fill = Channel)) + geom_col(position = “dodge”)

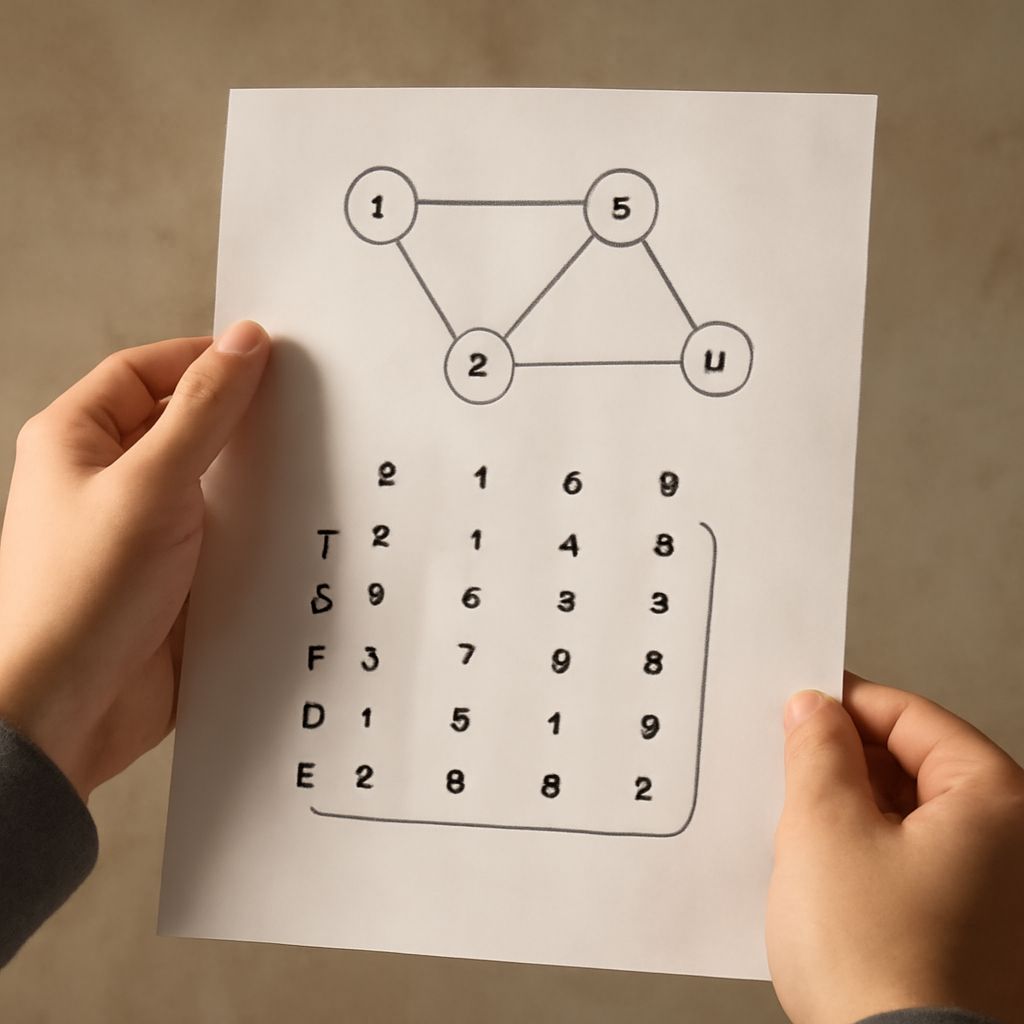
  • Adjacency Matrix for a Graph: Encoding Edges

    Adjacency Matrix for a Graph: Encoding Edges

    A graph adjacency matrix is a V×V array that records which vertices connect. Choose an order for the vertices, then use that same order for the rows and columns. If the order is A, B, C, D, row A and column A both refer to vertex A, so cell M[A,C] describes the edge between A and C.

    An adjacency matrix for a graph works especially well when fast edge checks matter or when the graph is dense. Its meaning changes slightly for undirected, directed, and weighted graphs, but the fixed vertex order remains the foundation.

    How an Adjacency Matrix for a Graph Stores Edges

    In a simple unweighted graph, a 1 usually means an edge exists and a 0 means no edge exists. Each edge maps to a specific row-column intersection. For example, M[B,D] describes the relationship from B to D; it is separate from M[D,B] when direction matters.

    The diagonal cells represent self-loops: M[A,A] concerns an edge from A back to A. If self-loops are not allowed, those cells remain zero or use the representation’s chosen “absent” marker.

    Build a Graph Adjacency Matrix from an Undirected Graph

    Start with four vertices in this order: A, B, C, D. Suppose the undirected edges are A–B, A–D, B–C, and C–D. Place a 1 at both endpoints’ intersections for every edge:

    • Row A: 0 1 0 1
    • Row B: 1 0 1 0
    • Row C: 0 1 0 1
    • Row D: 1 0 1 0

    The first value in every row belongs to column A, the second to B, the third to C, and the fourth to D. Because an undirected edge has no preferred direction, M[A,B] and M[B,A] contain the same value. The entire matrix is therefore symmetric across its main diagonal. Changing the vertex order changes the layout, but not the graph’s connections.

    How Direction and Weights Change the Same Matrix

    Keep the order A, B, C, D, but direct the connections as A→B, A→D, C→B, and D→C. Now each row is the source vertex and each column is the destination:

    • Row A: 0 1 0 1
    • Row B: 0 0 0 0
    • Row C: 0 1 0 0
    • Row D: 0 0 1 0

    This matrix is asymmetric. For example, M[A,B] is 1, while M[B,A] is 0 because the reverse edge does not exist. To add weights, replace each 1 with the edge’s value. Using weights 5, 2, 4, and 7 for those four directed edges gives rows 0 5 0 2; — 0 — —; — 4 0 —; and — — 7 0. Here, an em dash marks no edge, while 0 on the diagonal means no self-loop.

    Do not automatically use zero to mean “no edge” when zero-weight edges are valid. Use a separate presence marker, a null value, or another documented sentinel instead. This distinction prevents a real zero-weight connection from being mistaken for a missing edge.

    When Is a Graph Matrix Better Than an Adjacency List?

    A graph matrix uses O(V²) storage, regardless of how many edges exist. In return, checking whether an edge connects u and v takes constant time: read M[u,v]. Adding or removing an edge also takes O(1) time when the matrix is already allocated. Scanning all neighbors of one vertex takes O(V), because the algorithm may inspect the whole row.

    An adjacency list stores only existing edges, using O(V + E) space, and is usually better for sparse graphs. Neighbor traversal takes O(V + E) across the graph, while checking one edge typically takes O(degree(u)) unless each list uses an additional lookup structure. Choose a graph matrix for dense graphs, repeated direct edge lookups, or algorithms that examine most vertex pairs; choose an adjacency list for sparse graphs and traversal-heavy workloads.

  • Quicksort Example: Pseudocode, Partition, and Recursion

    Quicksort Example: Pseudocode, Partition, and Recursion

    This quicksort example uses the Lomuto partition scheme, with the last element as the pivot and 0-based inclusive bounds. It shows the exact quicksort pseudocode, a complete partition trace, and the recursive calls needed to sort an array in place.

    At each call, partition places the pivot in its final position. Quicksort then processes the elements to its left and right. A range containing zero or one element is already sorted.

    Quicksort Example: The Divide-and-Conquer Plan

    For a range A[low..high], choose a pivot and rearrange the range so values on one side are less than or equal to it, while values on the other side are greater. The partition function returns the pivot’s final index, p.

    The recursive calls use low..p-1 and p+1..high. The pivot is excluded from both calls because it is already in the correct position.

    This implementation uses Lomuto consistently: the pivot is A[high], the scan index j runs from low through high-1, and i marks the next position for a value less than or equal to the pivot.

    Quicksort Pseudocode with Lomuto Partition

    Use inclusive, 0-based indices. The base condition low >= high stops recursion.

    QUICKSORT(A, low, high)

    1. If low < high, set p = PARTITION(A, low, high).
    2. Call QUICKSORT(A, low, p – 1).
    3. Call QUICKSORT(A, p + 1, high).

    PARTITION(A, low, high)

    1. Set pivot = A[high].
    2. Set i = low.
    3. For each j from low to high-1, if A[j] <= pivot, swap A[i] and A[j], then increase i by one.
    4. Swap A[i] and A[high].
    5. Return i.

    After partitioning, every element before index i is less than or equal to the pivot, and every element between i+1 and high is greater. The returned index is therefore the boundary for the two recursive ranges.

    Partition Trace: Array Changes and Recursive Bounds

    Trace A = [9, 4, 7, 3, 10, 5] with QUICKSORT(A, 0, 5). Lomuto selects 5, the final element, as the pivot.

    • j = 0: 9 is greater than 5, so no swap occurs. The array remains [9, 4, 7, 3, 10, 5].
    • j = 1: 4 qualifies. Swap positions 0 and 1: [4, 9, 7, 3, 10, 5]. Now i = 1.
    • j = 2: 7 is greater than 5, so the array is unchanged.
    • j = 3: 3 qualifies. Swap positions 1 and 3: [4, 3, 7, 9, 10, 5]. Now i = 2.
    • j = 4: 10 is greater than 5, so the array is unchanged.
    • Final swap: Swap A[2] and A[5]: [4, 3, 5, 9, 10, 7]. Partition returns p = 2.

    The next bounds are QUICKSORT(A, 0, 1) and QUICKSORT(A, 3, 5). The left call uses pivot 3, producing [3, 4, 5, 9, 10, 7] and p = 0; its subcalls are (0, -1) and (1, 1), both finished ranges.

    The right call uses pivot 7, producing [3, 4, 5, 7, 10, 9] and p = 3. Its right range (4, 5) uses pivot 9, producing [3, 4, 5, 7, 9, 10] and p = 4. The remaining bounds, (3, 2), (4, 3), and (5, 5), meet the base condition.

    Time, Space, and Pivot Choice in Quicksort

    Each partition scans its current range once. With reasonably balanced splits, the recurrence is T(n) = 2T(n/2) + O(n), giving average or expected time of O(n log n). If the pivot is repeatedly the smallest or largest value, the recurrence becomes T(n) = T(n-1) + O(n), producing worst-case time of O(n²). A sorted array and a last-element pivot can create this worst case.

    Lomuto rearranges the array in place, requiring O(1) auxiliary storage apart from the recursion stack. Stack space averages O(log n) with balanced splits and can reach O(n) in the worst case. Randomized pivots or median-of-three selection reduce imbalance; move the selected pivot to A[high] before applying the same Lomuto rules.

  • Sequential Search: How Linear Search Scans a Collection

    Sequential Search: How Linear Search Scans a Collection

    Sequential search scans a collection from left to right, comparing the target with one item at a time. It returns the index as soon as it finds a match. If it reaches the end without a match, it returns a not-found result such as -1.

    The method is useful when a collection is small, unsorted, or stored in a structure that does not support fast random lookup. Its running time depends on how many items the scan must compare.

    How Does Sequential Search Scan a Collection?

    Linear search begins at index 0 and examines each item in its existing order. For every position, it performs one equality comparison between the current item and the target.

    1. Start at the first item.
    2. Compare the current item with the target.
    3. If they match, stop and return the current index.
    4. If they do not match, move to the next item.
    5. If no items remain, return the not-found result.

    The scan stops early when the target appears near the beginning. It must inspect more of the collection when the target appears later or is absent. A sequential search does not rearrange the collection, so the order remains unchanged.

    Linear Search Example: Found and Not Found

    Consider this list, where indexes begin at zero:

    [14, 3, 27, 8, 19]

    To find 8, linear search makes these comparisons:

    1. Index 0: compare 14 with 8 — no match.
    2. Index 1: compare 3 with 8 — no match.
    3. Index 2: compare 27 with 8 — no match.
    4. Index 3: compare 8 with 8 — match.

    The search returns index 3 after four comparisons.

    To find 25, the search compares 25 with 14, 3, 27, 8, and 19. None matches, so the search returns -1 after five comparisons. This is a not-found result because every item was checked.

    If the target were 14, the first item would match immediately. That found case would require only one comparison.

    Linear Search Pseudocode: Return an Index or Not Found

    The following pseudocode returns the first matching index. It returns -1 when the target is missing, including when the collection is empty.

    linearSearch(items, target)

    1. For index from 0 through the last index in items:
    2. Compare items[index] with target.
    3. If they are equal, return index.
    4. After the loop finishes, return -1.

    Returning as soon as a match appears makes the result the first occurrence when duplicate values exist. For example, searching [5, 2, 5] for 5 returns index 0 rather than continuing to index 2.

    What Is Linear Search Time Complexity?

    Linear search time complexity describes how the number of comparisons grows with the collection size, represented by n.

    • Best case: O(1). The target is the first item, so the algorithm performs one comparison.
    • Average case: O(n). If a present target is equally likely to occur at any position, the scan makes an average of (n + 1) / 2 comparisons. This simplifies to O(n).
    • Worst case: O(n). The target is the final item or is not present, so the algorithm checks all n items.

    The exact comparison count follows the trace: position i requires i + 1 comparisons, while an absent target requires n. The algorithm uses O(1) auxiliary space because it stores only the current index and target-related variables; it does not create another collection.